

By Michelle Savage, Vice President, Communication, XBRL US
On its own, AI is a powerful analytical tool. XBRL can supercharge its responses.
Last month we published a blog, AI is smarter with structured standardized data, about an academic study that analyzed thousands of SEC filings to learn what could boost the accuracy of information returned by Large Language Models (LLM). The study found higher success in AI accuracy when using structured XBRL data (versus text or HTML).
We tested the theory ourselves, leveraging our XBRL US Public Filings Database which contains structured, standardized data from companies reporting to the Securities and Exchange Commission (SEC), the Federal Energy Regulatory Commission (SEC) and the European Union (EU). We gave the desktop version of Anthropic’s Claude LLM access to the database of 15+ years of structured, machine-readable data through an MCP server (model context protocol).
Our first task? Analyze company segment data.
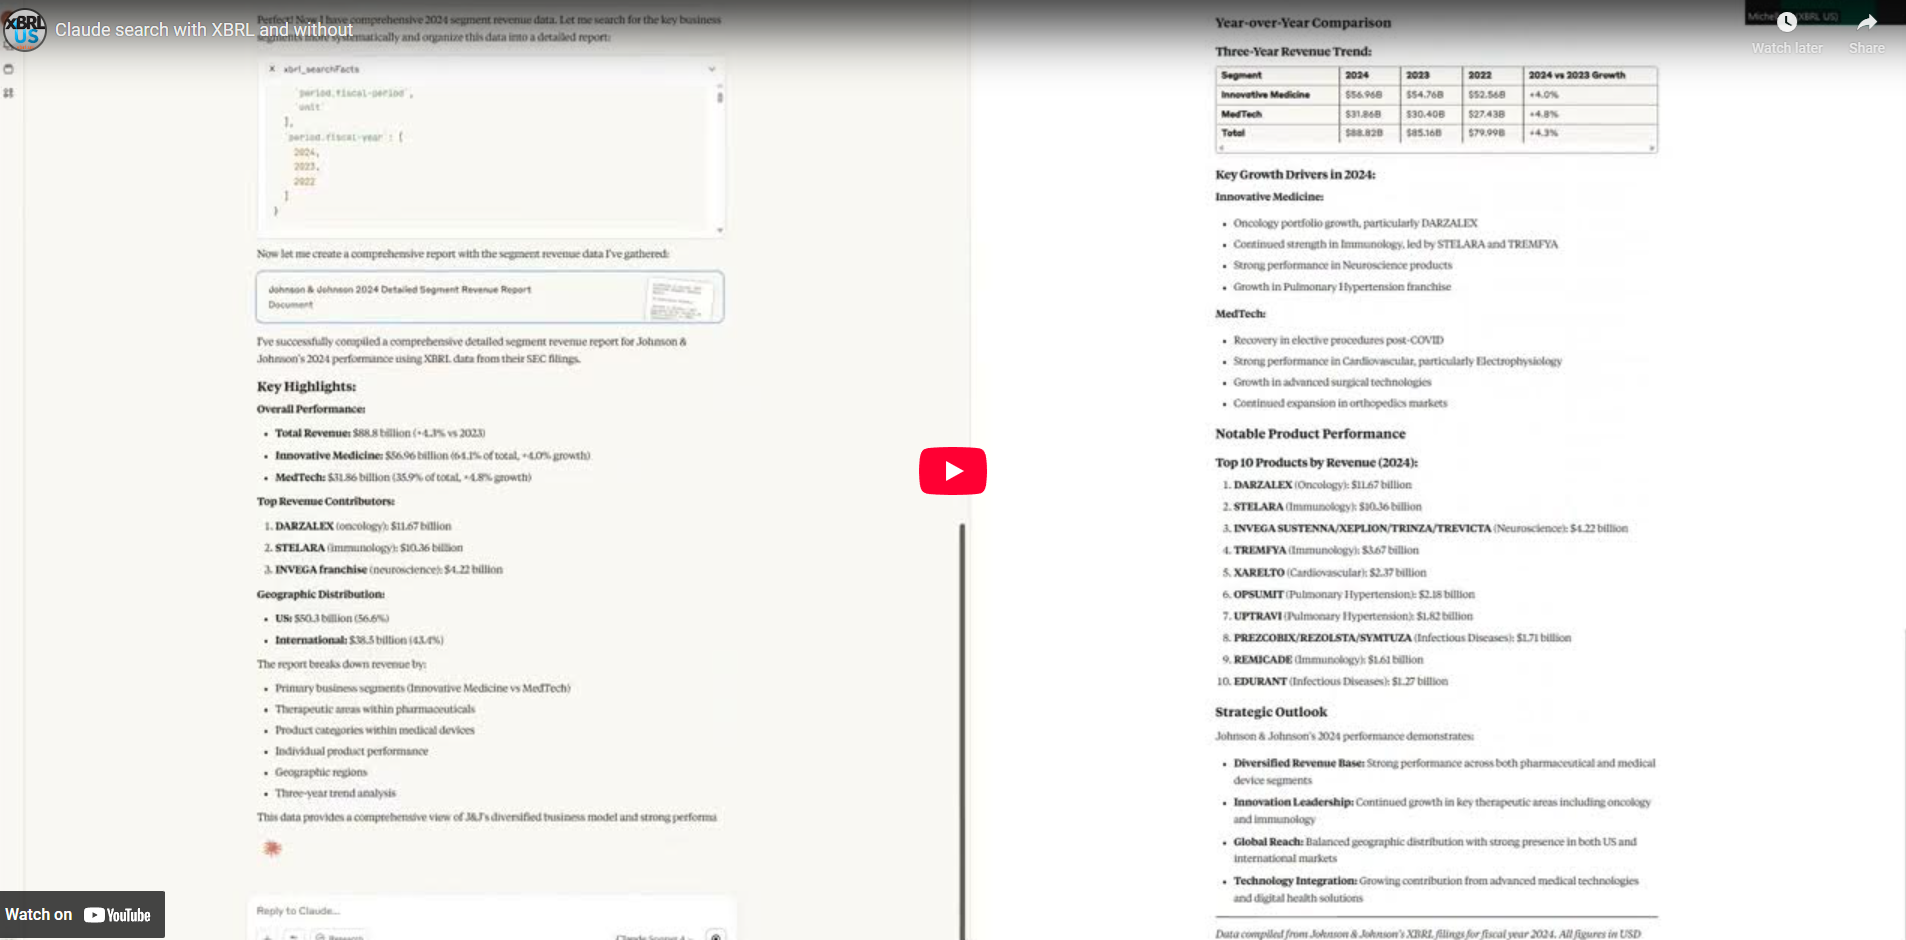
Segment data is often buried in the notes to the financials, so we knew finding and extracting it would be a challenge for AI. Claude was asked to report detailed revenue data by segment from Johnson & Johnson’s (J&J) full year 2024 financials, first without using XBRL data. (Check the final Claude responses for both "with" and "without" XBRL data here: APPENDIX - JJ Results of Search and to see the LLM in action, go to "click to watch" above.)
Claude's response noted 2024 sales for the full company of $88.8 billion, along with 2024 sales figures for the company's two primary operating segments: Innovative Medicine, at $56.964 billion and MedTech at $31.857 billion. These figures were accurate when compared against the 2024 J&J SEC filing.
Claude also named and briefly described the subsegments within each of the two primary segments. Q4 figures were provided for a few subsegments but no full year 2024 revenue. Claude provided a geographic breakdown of total revenue into U.S. and International amounts. The LLM told us the sources of the data pulled which included J&J’s Q1 and full-year 2024 financials, plus various financial and pharmaceutical news sites like Motley Fool, fiercepharma.com, phaarmalive.com, nasdaq.com, Yahoo, and Wikipedia.
We then used the same prompt, but this time asked Claude to use XBRL data through the MCP server.
The XBRL-powered response was more detailed. Claude gave exact figures not only for the two operating segments but in-depth revenue details for subsegments within each segment and for products within the subsegments.
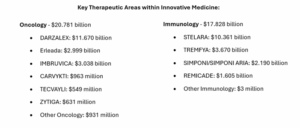
The Innovative Medicine segment, for example, has six subsegments: Oncology, Immunology, Neuroscience, Pulmonary Hypertension, Cardiovascular/Metabolism/Other and Infectious Diseases. Not only did the prompt provide 2024 revenue figures for each of these sub-segments, but it included revenue breakdowns by type of drug and geography (US versus other). The Oncology subsegment has six separate drugs plus a general category of "other oncology". Using XBRL data, revenue figures for 2024 were provided for every drug.
The table below shows the data reported when using XBRL sources for two of the six therapeutic areas in Innovative Medicine. None of these details were available in the responses received when not using XBRL data.
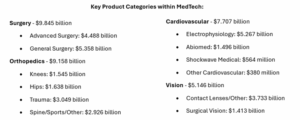
Similarly, MedTech has four subsegments: Cardiovascular, Surgery, Orthopedics, Vision Care. The response leveraging XBRL data gave us revenue for each subsegment and for individual products within each subsegment. Below shows the four subsegments in MedTech with associated product categories. Again, this level of detail was not provided when Claude responded without using XBRL data.
With XBRL data, the LLM also provided a more comprehensive regional categorization, including breakouts for the U.S., Europe, Asia Pacific/Africa, and the Western Hemisphere.
This table highlights the differences between AI used with structured, standardized data and without.
| With Structured, Standardized Data (XBRL) |
Without Structured, Standardized Data (XBRL) |
|
|---|---|---|
| Data accuracy | High | High |
| Completeness - Data Available: | ||
| Full year top level segment data (Segments Innovative Medicine and Medical Devices) | Yes | Yes |
| Sub-segment data (Breakdown within a segment, e.g., Innovative Medicine (Pharmaceuticals) has six subsegments) | Yes | No |
| Revenue breakdown within subsegments, e.g., Oncology subsegment in Innovative Medicine, has 7 drug categories) | Yes | No |
| Geographic breakdown by company | Totals for US, Europe,Asia Pacific/Africa, Western Hemisphere | Totals for US and International |
| Data Source | J&J 2024 10-K filing | J&J 2024 10-K jnj.com; nasdaq.com; fiercepharma.com; pharmalive.com; fool.com; stocktitan.net; biopharmadive.com; yahoo.com; wikipedia.org |
Using XBRL as the source for AI led to more granular detail and insights into segment data by both line of business and geography compared to performing the same task with unstructured data. Furthermore, the results were entirely based on the most reliable source - the company’s own financials. Data sourced from third-party websites like Yahoo! Finance or The Motley Fool may be normalized for easy comparison, and can vary from data reported directly by the company.
But will AI just keep getting better and better, eliminating the edge that structured data has today?
AI algorithms improve their ability to predict by training against large volumes of data. For example, self-driving cars early on were challenged when predicting what would happen next because of the enormous variability of roads and lane markings, the unpredictability of pedestrians who might cross against the light, or animals who simply don't follow the rules of the road. But with time and experience, they improved. A Time Magazine article from June 26, 2025 noted "Waymos do not drive perfectly. But scores of data suggest that they are already much safer than human drivers, reducing injury-causing collisions by around 80%."
Self-driving cars collect a massive amount of data from sensors like cameras and radar that give them a detailed picture of road layouts, other cars, pedestrians, road signs, and obstacles - everything that composes the "driving data model". With the data model in hand, they can become relatively good predictors of what will happen next on the road.
An XBRL taxonomy is a highly structured data model, typically of financial statement data. The financial statement data model defines the facts that can be reported and how those facts intersect with each other, e.g., Cash is classified as a Current Asset, Revenues appear on an Income Statement. The rules in a taxonomy give an AI engine information it can use to understand facts prepared using that model. It provides the contextual information that makes it possible to reliably predict what a fact represents. Without the construct of the data model, AI is "flying blind" and must resort to text searches on information that is not consistently prepared like interpreting a line item caption like "Property, Plant and Equipment" on a Balance Sheet.
That’s why having access to the structured, standardized data model (in a taxonomy) along with the data that fits into that model (financial statements prepared using a taxonomy) will always give LLMs the contextual information to make accurate and reliable predictions.
Stay tuned as we continue to explore the world of artificial intelligence and how XBRL can support AI, and how AI can support XBRL.
To view the LLM responses to both prompts: APPENDIX - JJ Results of Search and to see the LLM in action, go to "click to watch" above.