

AI Needs Structure, and Structure Needs AI
Posted Thursday, November 19It’s now widely accepted that AI performs better with structured, standardized, context-rich data than with unstructured content.
Consider online shopping where you can filter instantly by brand, size, and price and see only what matches. In a thrift-store bin, you dig through everything by hand and hope you didn’t miss something. Tagged reporting gives regulators, investors, and increasingly, AI tools, those same unambiguous filters. Academic studies and investment research backs this up.
The relationship also works the other way. AI can make it easier to produce structured, standardized data in the first place, as long as it is anchored to a semantic layer that tells it what the data means. Regulators should keep this in mind as they set disclosure requirements for data collections under the Financial Data Transparency Act (FDTA) and define requirements for digital asset programs under the GENIUS Act. As they balance the needs of investors against reporting burdens on issuers, remember that AI is already making it easier for issuers to report.
We tested both ideas.
AI Needs Structure
We asked Anthropic’s Claude to analyze the four largest grocery chains, comparing operating margin and gross margin over the past three years. We ran the analysis two ways. The first used data extracted from XBRL filings through an MCP server. The second used data pulled directly from unstructured documents.
Both approaches reached the same conclusions, because the tasks produced identical underlying numbers.
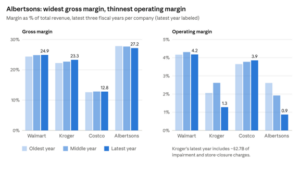
That’s where the similarities ended.
The XBRL-based analysis used 11,801 tokens. The unstructured analysis used 20,912, nearly 80% more.
With structured data, Claude pulled numbers directly from the four grocers’ SEC financial statements. With unstructured data, it had to read through long financial documents and the algorithm stopped after 100,000 characters. After a couple more attempts, it switched to finding data in the companies’ earnings releases, which were shorter and easier to parse.
In this case, the earnings release figures matched the 10-Ks. That isn’t always true. Earnings releases are unaudited and come out before the 10-K. The 10-K financial statements are audited, and that audit is a big part of why investors trust the numbers.
What gives structured XBRL data its advantage is the semantic layer, detailed information about what each reported fact actually means. With unstructured data, AI has to infer meaning from rough clues like row and column headers and where a number sits in a table. In XBRL, every reported number carries its definition, label, time period, period type, and scale (thousands or millions?), and often authoritative references to accounting standards. That semantic layer is the XBRL taxonomy, or ontology. Every number points to it, so AI results stay anchored to it.
The bottom line: structured data uses far fewer tokens and is more trustworthy than unstructured data. Both advantages come from the semantic layer, which keeps the LLM tied to reality.
Structure Needs AI
Public companies, investment managers, banks, and even utilities already prepare data in structured, context-rich formats as a matter of routine. Advances in AI are now making the “tagging” process simpler and faster.
Many reporting tools already use LLMs to produce a first pass of tags. A human stays in the loop and reviews the choices made by AI. This works because the software uses the semantic layer, the XBRL taxonomy, as the authoritative anchor for every fact in a financial statement.
As AI improves, report preparation gets easier.
To see this in action, we gave Claude an unstructured PDF of The Kroger Co.’s balance sheet for the period ending August 15, 2026, and asked it to make sense of the data in two ways:
- Table-only: capture the data by reading the financial tables alone.
- Taxonomy-anchored: capture the data using the US GAAP Taxonomy as the semantic layer.
The table-only approach produced a spreadsheet with the numbers and labels exactly as they appeared on the balance sheet. It was fast and simple, kept the original presentation, and used an estimated 2,000–3,000 tokens.
The taxonomy-anchored approach cost more, an estimated 8,000–12,000 tokens, but it delivered far more. The spreadsheet had the same values and presentation labels, and it also mapped each value to its US GAAP Taxonomy concept name, standard label, data type, balance type, period type, and dimensions. It identified company-specific (custom) concepts and explained how each one connects to standard GAAP concepts. Each number was extracted on its own, then researched and verified against the US GAAP Taxonomy.
Anchoring the process to the semantic layer produced data a machine can read and understand. Because the data is standardized against the FASB’s US GAAP Taxonomy, an authoritative accounting source, it can be compared automatically across companies and reports. It can be checked for accuracy with automated validation rules. And it works in financial analytics tools right away, because the software can tell on its own what each value represents, whether that’s cash, goodwill, or anything else.
The Payoff
Anchoring data preparation to the semantic layer produces data that is machine-readable, structured, and standardized against a trusted, authoritative source.
Structured reporting costs more to prepare than unstructured reporting, but the savings on the analysis side far outweigh that cost. A report is prepared once and analyzed many times, so the savings add up with every use. And as AI keeps improving, structured reporting will keep getting easier and faster.



Comment
You must be logged in to post a comment.