

By Christine Cheng*, Assistant Professor, Patterson School of Accountancy at University of Mississippi; and Campbell Pryde, President and CEO, XBRL US
Controversial questions require the right dataset. Case studies are often the best tool for students to learn how to untangle the complexities of public company financial statements to get answers to important questions. Access to high quality, timely data can help illustrate the impact of current events and make analysis significantly more relevant to students.
Professors at the Patterson School of Accountancy at the University of Mississippi asked their students to investigate the controversy over companies that pay no taxes despite having substantial pretax profits in the U.S. The analysis referred students to an April 2021 report[1] that was prepared by the nonprofit tax policy organization, Institute on Taxation and Economic Policy (ITEP). The ITEP report names 55 large companies that paid no tax in 2020. The students were asked to investigate the Effective Tax Rate (ETR) for these companies and determine if they differed from that of peers.
The focus of this paper is on how this analysis was conducted using two different data sets - a commonly used commercial data set, and an XBRL-formatted data set.
Using commercial data sets
Initially, students relied on a commercially available data set of 20 years of financial accounting data from companies 10-K statements. Students analyzed statistics, conducted time series and linear regression analyses.
Commercial data sets, to improve comparability of data from company to company, are usually “normalized” - structuring as-reported data in accordance with a set of norms set by the data provider, in order to reduce data redundancy and improve data integrity, so that all the data looks and reads the same way across records in a relational database. Normalized data often aggregates companies' reported facts, so that multiple companies can be compared across a single line item. While this can be extremely helpful for trend analysis and comparability, it removes the specificity of as-reported data, hiding the details about individual companies' actions.
This was the case for students tackling the ETR analysis. They found that they were unable to determine statistically significant associations between the companies and various economic factors, including ETRs. The loss of detail in commercial data sets can impact their usefulness in certain types of data modeling. Pulling data directly from company financial reports would be more useful for this case study, but is labor-intensive and time consuming.
Using XBRL data
The same question was posed in a new student project, but this time, as-reported XBRL data was used instead of commercial data sets. XBRL, which stands for eXtensible Business Reporting Language, is a standard for structuring financial and business data. An XBRL-formatted financial statement can be prepared in multiple formats (XML, JSON, HTML or CSV) and is fully machine-readable and searchable. The Securities and Exchange Commission (SEC) began requiring companies to report in XBRL in 2009, so there is a large pool of historical data freely available for use.
Reporting companies prepare their financials in XBRL, so that as soon as the SEC posts the company file online, it is unambiguously machine-readable and can be automatically extracted into databases.
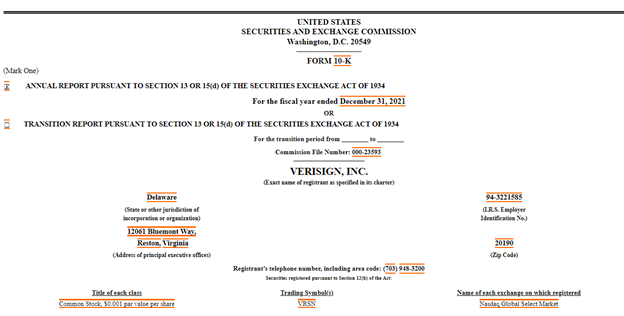
XBRL data provides a ready tool for students because public companies that report in XBRL do so using a technology called “Inline XBRL”, which renders the data machine-readable and highlights each fact that has an embedded XBRL “tag”. Verisign’s 10-K report below shows orange bars outlining each tagged fact, which includes text and narrative facts in addition to financials. Students reviewing a report like this on the SEC web site can click on any highlighted fact and see all the characteristics of the fact, further illustrating how companies choose to prepare their financial statements.
The Case Study: Tax Data and XBRL Tagging
Students were tasked with determining why companies were on the ITEP list. How can profitable firms manage to pay no taxes, or even receive tax refunds? Companies have to report a reconciliation between the U.S. Statutory Tax rate which is 21%, and their own ETR, which is the average or actual tax rate the company paid on their pretax income. The case study provided to students used Verisign as an example because it is one of the companies on the ITEP list.
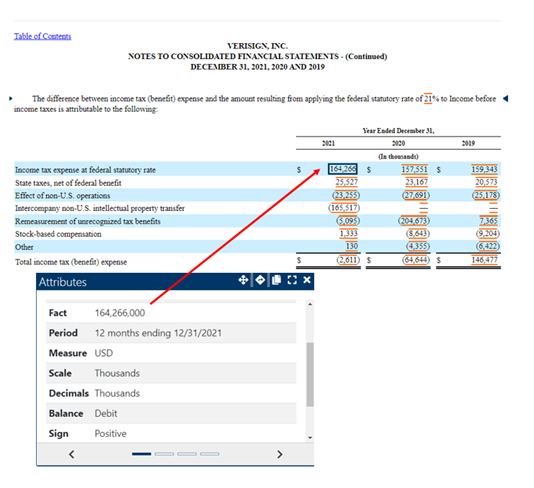
The first task in the case study was to identify the tax reconciliation table in the company’s Form 10-K. Below is the table from Verisign’s 10-K for the period ending December 31, 2021. The first row shows the computed expected tax expense, calculated as if Verisign’s tax rate matched the 2021 statutory tax rate of 21%. By clicking on the fact reported, students can see that the value 164,266 represents the amount of tax that Verisign would have been expected to pay at the federal statutory tax rate. The popup box shown below which the SEC makes available to depict the metadata associated with tagged facts, lets the students know that the value is reported in thousands of dollars.
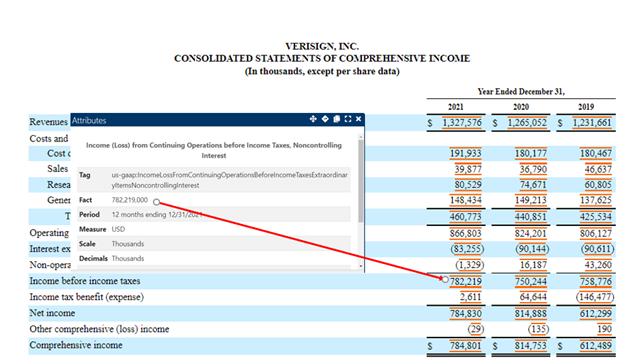
To make sure students understand how the value is calculated, they researched further in the statement to find Verisign’s pretax income as shown on the figure below. The value 782,219 multiplied by the 21% ETR equals the computed expected tax of 164,266 as shown on the reconciliation table above. And again, these figures are all reported in thousands.
Returning to Verisign's reconciliation table again as shown below, Verisign’s tax expense in 2021 was adjusted by a number of factors. First, it was increased as shown in the second line item, because Verisign pays state taxes in addition to federal income taxes in all years.
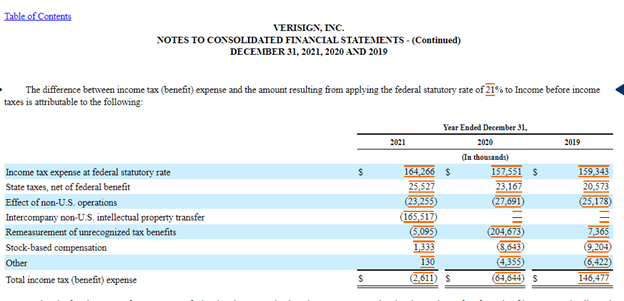
On the third and fourth rows of the table, students can note that Verisign enjoys a lower effective tax rate because they record earnings and intellectual property in foreign subsidiaries. These foreign subsidiaries are located in lower tax jurisdictions, and thus, allow Verisign to reduce their effective tax rate below the statutory tax rate in all years. Continuing down the table line items, Verisign also enjoys tax breaks from a remeasurement of unrecognized tax benefits. In the most recent year, Verisign’s stock-based compensation increased its tax liability, however, the stock-based compensation reduced Verisign’s tax liability for the prior two years.
Many companies also include an ‘Other’ line, which is a catchall category for differences that are not material enough to be reported on a separate line. Finally, the table reports the actual provision for income tax expense. Students could find Verisign’s 2021 effective tax rate of (0.33%) by dividing Verisign’s Total income tax (benefit) by their pretax ((2,611) divided by 782,219).
How Students Can Gain from Using As-reported XBRL data
- The higher degree of specificity available in as-reported data allows students to answer more questions when researching the impact of policy and other economic factors on individual companies.
- The consistency of underlying XBRL tags (regardless of the company-assigned line item label) ensures ease of comparison from company to company.
- The ability to visualize the metadata associated with each reported fact through Inline XBRL (like the viewers shown above) can enhance the learning experience for students by showing them other characteristics of a reported fact, such as data type, units, level of precision and even balance type.
- Students will gain from their knowledge of XBRL - the de facto standard for business reporting, which is used in 184 regulatory programs worldwide. Every data scientist, accountant, and financial analyst should have a good understanding of XBRL. Gaining this knowledge as students will assist them in future career efforts.
Academics wishing to get started using this case study along with current and historical XBRL financial data can learn more and gain access to case study materials for their own use here: XBRL and SQL A Teaching Case for Collecting Granular Firm Level Data. As an XBRL US Academic Institutional Member, our students used SQL to gather the data under an arrangement with XBRL US, and there's also a a Python script for gathering the data that works with the XBRL API and queries the XBRL US Public Filings Database (you'll need to have a free Web account provisioned to use the XBRL API to run the script).
Contact us to find out how you can gain access to XBRL data for your own classroom and research use at info@xbrl.us.