Campbell Pryde, President and CEO, XBRL US
Conducting simple queries, like identifying the filings that contain the most reported facts, used to be extremely time-consuming and labor-intensive to perform. Performing comprehensive data extractions across thousands of individual filings meant culling through text or PDF reports. A lot of basic analysis just didn’t happen because it was cost prohibitive. Or, rather than pulling data from 6,000 or so public companies, analysts “sampled” company datasets, opting to just look at the S&P 500 or a specific industry group.
Today, the availability of structured, machine-readable (XBRL) data and the XBRL API makes getting answers - using simple or complex queries - easy.
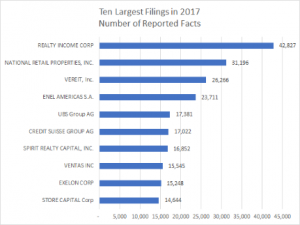
We used the XBRL US API to pull a list of the filings in 2017 that contained the highest number of reported facts. Realty Income Corporation topped the list with 42,827 individually tagged facts. Interestingly, six of the top ten were real estate investment trusts (REIT). Two were electric services companies, involved in generating, transmitting, and distributing electricity; and two were financial services (bank and security broker).
It’s not surprising that REITs top the list. REITs are companies that manage pools of income-producing properties and offer common shares to the public. REITs typically specialize in a type of property, for example, there are retail REITs, office REITs, residential REITs, healthcare REITs and industrial REITs.
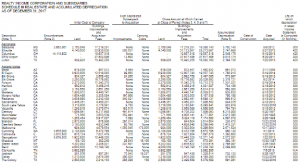
REITs tend to report a lot of facts because of the data-intensive Schedule III Real Estate and Accumulated Depreciation required to be reported in their SEC filing. Schedule III provides extensive details about the individual properties held by REITs, including original purchase price, cumulative capital improvements, the year the property was acquired or developed, and accumulated depreciation and amortization. The diagram below shows a portion of the Schedule III for Realty Income Corporations 2017 10-K.
Analyzing and understanding the properties owned by a REIT requires crunching a lot of numbers. But because this data is available in machine-readable XBRL format, it can be extracted and dropped into a spreadsheet application in seconds. Before XBRL, this data was reported in ASCII Text or HTML, and analysis was time-consuming and expensive to extract and analyze.
Without XBRL, identifying the filings with the highest number of reported facts would also be prohibitively expensive to conduct. Today, that analysis can be performed in seconds using XBRL analytical tools.
In fact, the screen grab below shows the SQL Query used to generate the list.
What kind of analysis can you do today that would be too expensive in a world without XBRL?
Check out the XBRL API to find sample queries like the one above and sign on to access the XBRL API for yourself .


