

XBRL data gives small businesses the tools to conduct critical analysis needed to make “go/no go” decisions on major life cycle changes. Should a company go public? Merge with another company? Be acquired? Understanding the path taken by other small businesses can help them determine the best course for themselves. With tools like XBRL data available today, they can perform in an hour, analysis that used to take months.
Situation
Small businesses considering an IPO, merger or acquisition, have to do their due diligence. That can include research on the size of the market, the predictability of their business model, the competitive framework in which they operate, and an honest look at the quality of their own management and financial staff. They need to consider: Is now the right time to go public? What other funding options exist? Should they join forces with other companies through a merger or acquisition? How much should a company like theirs spend on marketing? On R&D? Are they ready to take on the transparency requirements of being public?
Smart companies making the go/no go decision on an IPO or other significant action often evaluate the financial performance of other companies in their space when they were fledgling companies. For example, what did Facebook spend on R&D back in 2012 when it first went public? When Twitter went public in 2013, what was it spending on marketing? Or, as in the example below, how was share-based compensation allocated to employees and directors versus non-employees? How did share-based compensation change over time?
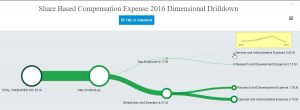
Source: idaciti
The ability to analyze what successful companies (and even what unsuccessful companies) did when they were first accessing the capital markets can be incredibly helpful in gauging the potential for success.
US GAAP data, like revenue and expenses, are important, but non-GAAP data is often equally important. For example, revenues per employee, adjusted EBITDA, adjusted sales and marketing expenses, not to mention all the data buried in a company’s Management Discussion & Analysis (MD&A), tell a story about how that company grew into what it is today.
Startups need to get out the history book to benchmark themselves against other companies in their field. Understanding the trajectory of how a startup seedling grows into today’s giant oak is critical to the learning process for small companies and to the health of the capital markets. And incidentally, that same kind of historical analysis is important to regulators and investors too. Small companies are a critical part of the U.S. economy. We need data to understand how they were able to succeed or fail.
Before
Small companies generally have limited resources to conduct this kind of in-depth analysis. They need access to inexpensive, timely, comprehensive financial information. Before the availability of structured, easily accessible XBRL data, small businesses considering an IPO or other major action, might visit Yahoo Finance to pull top-line financials. But that wouldn’t give them comprehensive financials and certainly not the detailed information that’s buried in footnotes and the MD&A of financial statements.
To find that level of data required searching through individual company filings on the SEC’s EDGAR system, and pouring over printed MD&A and footnotes. Each company they analyzed required a lot of time reading and manually extracting data before a sufficient amount of information was available. The labor-intensive nature of such a process meant that any analysis would cover a limited number of companies, at best.
After
But today, in a world where structured data is available, analysis that may have taken a month to complete in the past, can now be done in an hour.
Numerous analytical data tools are on the market today, from large and small providers, that pull in structured XBRL financial data and serve it up to clients on various platforms. XBRL data is freely available on the SEC EDGAR system. It is computer-readable and each reported value has a corresponding definition and metadata that defines units, time period and precision such that it can be automatically extracted and used. This makes XBRL substantially less expensive to process and more timely.
Detailed data from small companies is available at the same time as large companies, which means that small businesses can perform due diligence tasks faster and less expensively. Public companies file their comprehensive financials plus detailed information that is found in footnotes - all information that startups need as they assess the pros and cons of a possible public offering.
idaciti is one analytical tool company that today works with lots of small companies, providing inexpensive, timely and highly granular data that they use when evaluating the IPO decision. idaciti is able to provide this information inexpensively and on a timely basis because it draws in freely available XBRL-formatted data from public companies, large and small. Pulling XBRL data from one company is the same as pulling XBRL data for 1,000 companies so their small company clients can access information on as many companies as they please.
idaciti quickly discovered that many small companies also want to see non-GAAP data that is hidden away in the MD&A - today, this data is not required to be formatted in XBRL. To access it requires the same laborious process mentioned earlier of pouring over printed documents for multiple companies. To respond to client demand, idaciti created an analytical tool that allows companies to extract values from the MD&A of company financials and quickly visualize this information. Small businesses can then overlap the GAAP and non-GAAP data as shown in the screenshot below which shows how XBRL data can be combined with non-XBRL data (non-GAAP data) to look at trends over time. This is an example of Facebook's GAAP and non-GAAP Diluted Earnings per Share.
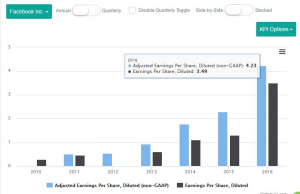
Source: idaciti
One of the most important measures for social media companies is number of active users which is a non-GAAP measure. Startup companies in the social media space can glean important insights from this information that could change the direction of their strategy. The table below shows average monthly active users for Facebook over time.
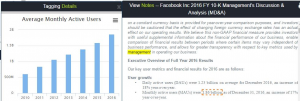
Source: idaciti
Life would be easier for small businesses if non-GAAP data like this was also available in XBRL format.
Conclusion
We all know that important lessons can be learned from history.
The story of how small businesses grow into big businesses needs to continue being told. Not just to benefit investors and regulators, but to encourage more small businesses to learn from others and put that information to use.
Learn more about idaciti.
View the infographic on other XBRL data users and how they benefit.
XBRL data gives small businesses the tools to conduct critical analysis needed to make “go/no go” decisions on major life cycle changes. Should a company go public? Merge with another company? Be acquired? Understanding the path taken by other small businesses can help them determine the best course for themselves. With tools like XBRL data available today, they can perform in an hour, analysis that used to take months.
Situation
Small businesses considering an IPO, merger or acquisition, have to do their due diligence. That can include research on the size of the market, the predictability of their business model, the competitive framework in which they operate, and an honest look at the quality of their own management and financial staff. They need to consider: Is now the right time to go public? What other funding options exist? Should they join forces with other companies through a merger or acquisition? How much should a company like theirs spend on marketing? On R&D? Are they ready to take on the transparency requirements of being public?
Smart companies making the go/no go decision on an IPO or other significant action often evaluate the financial performance of other companies in their space when they were fledgling companies. For example, what did Facebook spend on R&D back in 2012 when it first went public? When Twitter went public in 2013, what was it spending on marketing? Or, as in the example below, how was share-based compensation allocated to employees and directors versus non-employees? How did share-based compensation change over time?
Source: idaciti
The ability to analyze what successful companies (and even what unsuccessful companies) did when they were first accessing the capital markets can be incredibly helpful in gauging the potential for success.
US GAAP data, like revenue and expenses, are important, but non-GAAP data is often equally important. For example, revenues per employee, adjusted EBITDA, adjusted sales and marketing expenses, not to mention all the data buried in a company’s Management Discussion & Analysis (MD&A), tell a story about how that company grew into what it is today.
Startups need to get out the history book to benchmark themselves against other companies in their field. Understanding the trajectory of how a startup seedling grows into today’s giant oak is critical to the learning process for small companies and to the health of the capital markets. And incidentally, that same kind of historical analysis is important to regulators and investors too. Small companies are a critical part of the U.S. economy. We need data to understand how they were able to succeed or fail.
Before
Small companies generally have limited resources to conduct this kind of in-depth analysis. They need access to inexpensive, timely, comprehensive financial information. Before the availability of structured, easily accessible XBRL data, small businesses considering an IPO or other major action, might visit Yahoo Finance to pull top-line financials. But that wouldn’t give them comprehensive financials and certainly not the detailed information that’s buried in footnotes and the MD&A of financial statements.
To find that level of data required searching through individual company filings on the SEC’s EDGAR system, and pouring over printed MD&A and footnotes. Each company they analyzed required a lot of time reading and manually extracting data before a sufficient amount of information was available. The labor-intensive nature of such a process meant that any analysis would cover a limited number of companies, at best.
After
But today, in a world where structured data is available, analysis that may have taken a month to complete in the past, can now be done in an hour.
Numerous analytical data tools are on the market today, from large and small providers, that pull in structured XBRL financial data and serve it up to clients on various platforms. XBRL data is freely available on the SEC EDGAR system. It is computer-readable and each reported value has a corresponding definition and metadata that defines units, time period and precision such that it can be automatically extracted and used. This makes XBRL substantially less expensive to process and more timely.
Detailed data from small companies is available at the same time as large companies, which means that small businesses can perform due diligence tasks faster and less expensively. Public companies file their comprehensive financials plus detailed information that is found in footnotes - all information that startups need as they assess the pros and cons of a possible public offering.
idaciti is one analytical tool company that today works with lots of small companies, providing inexpensive, timely and highly granular data that they use when evaluating the IPO decision. idaciti is able to provide this information inexpensively and on a timely basis because it draws in freely available XBRL-formatted data from public companies, large and small. Pulling XBRL data from one company is the same as pulling XBRL data for 1,000 companies so their small company clients can access information on as many companies as they please.
idaciti quickly discovered that many small companies also want to see non-GAAP data that is hidden away in the MD&A - today, this data is not required to be formatted in XBRL. To access it requires the same laborious process mentioned earlier of pouring over printed documents for multiple companies. To respond to client demand, idaciti created an analytical tool that allows companies to extract values from the MD&A of company financials and quickly visualize this information. Small businesses can then overlap the GAAP and non-GAAP data as shown in the screenshot below which shows how XBRL data can be combined with non-XBRL data (non-GAAP data) to look at trends over time. This is an example of Facebook's GAAP and non-GAAP Diluted Earnings per Share.
Source: idaciti
One of the most important measures for social media companies is number of active users which is a non-GAAP measure. Startup companies in the social media space can glean important insights from this information that could change the direction of their strategy. The table below shows average monthly active users for Facebook over time.
Source: idaciti
Life would be easier for small businesses if non-GAAP data like this was also available in XBRL format.
Conclusion
We all know that important lessons can be learned from history.
The story of how small businesses grow into big businesses needs to continue being told. Not just to benefit investors and regulators, but to encourage more small businesses to learn from others and put that information to use.