

Executive Summary
Data used for investment decisions, policy-setting and risk assessment should be made available in non-proprietary machine-readable formats. Current best practices for disclosures as machine-readable data have improved quality, reduced the cost of processing, and improved timeliness and usability of reported data.
XBRL US ESG Working Group chaired by:
- Anna Kwok, Vice President, Structured Data Initiatives, Workiva
- Dean Ritz, Senior Advisor to the CEO, Open Data Policies & Practices, Workiva
As regulators reflect on the question of ESG disclosures for companies, they need to consider where ESG reporting is today and what needs to be done to improve the availability, timeliness, and quality of the data reported. They also need to consider how companies will meet new reporting requirements around ESG and how to minimize the burden of such reporting.
This paper recommends approaches that can be taken by regulators to address many of these issues which are briefly summarized here:
- Render ESG data machine-readable.
- Address how issuers will be able to manage multiple ESG frameworks.
- Help data users understand the relationships between ESG data modeled in other frameworks.
- Allow issuers to use standards that are an appropriate fit for their company.
- Provide issuers with guidance on XBRL to consider when telling their ESG story.
- Help issuers meet the needs of different data users.
- Allow data to be disaggregated and totaled.
- Ensure that graphical illustrations and narratives can be translated into computer-readable data.
- Enable commingling of ESG data with other data.
- Eliminate inconsistencies in data types and units to enhance comparability.
- Adopt a standard that allows the regulator to constrain data to specific units.
- Assist issuers in preparing good quality data with minimal burden.
- Provide guidance and validation to confirm that a submitted report is correct.
- Make data portable and easily accessible.
- Give data users the ability to identify the source of the data.
Background
There is increased interest among investors in obtaining consistent, comparable ESG-related data from companies worldwide, including those listed on U.S. markets. As noted in a blog from The Forum for Sustainable and Responsible Investment, U.S. assets under management using sustainable investing strategies grew 42%, from $12 trillion in 2018 to $17.1 trillion in 2020; and sustainable investing assets account for approximately ⅓ of assets under management. CFA Institute noted in an article in The Reporting Times, “Investors are now demanding sustainability information as they see environmental, social and governance (ESG) factors as vital to the evaluation of a company.”
Global regulators are paying close attention. Significantly, the IFRS Foundation announced the formation of the International Sustainability Standards Board (ISSB), tasked with creating digitized ESG-standards. In addition, the IFRS Foundation announced the consolidation of the Climate Disclosure Standards Board (CDSB) and the Value Reporting Foundation (VRF) (composed of the Integrated Reporting Framework and the Sustainability Accounting Standards Board (SASB)) by June 2022. On March 31, 2022, the ISSB delivered the initial draft of their proposed standards on general sustainability-related disclosure requirements, and on climate-related disclosure requirements, for a public review period closing July 29.
U.S. regulators are also taking action. On March 21, 2022, the Securities and Exchange Commission (SEC) published a rule proposal on The Enhancement and Standardization of Climate-Related Disclosures for Investors. The proposal calls for the mandated disclosures of certain climate-related information in their registration statements and annual reports, which are likely to have a material impact on its business, results of operations, or financial condition. Furthermore, the rule requires registrants “…to electrically tag both narrative and quantitative climate-related disclosures in Inline XBRL.”
Given the heightened interest in climate and other ESG-related disclosures, and the expectation that digitization of these disclosures is a needed part of the solution, XBRL US established the XBRL US ESG Working Group to investigate how eXtensible Business Reporting Language (XBRL) could be used to support the automation of climate and other ESG disclosures. The Working Group includes representatives who are SEC filers, corporate governance and investor relations professionals, analysts, and investors, as well as XBRL software providers. This paper, in addition to several XBRL-formatted ESG reports that illustrate how ESG data can be rendered machine-readable, are the results delivered by the Working Group.
The paper presents issues in ESG reporting today, and explains how data standardization can assist by providing relevant information in a format that supports evaluation and comparability. Implementations of machine-readable data can be created when the reporting area (e.g., ESG) is backed by domain standards that concretely define terms and how terms are related to each other. It is this related-ness that raises the standard to that of a framework, as a framework captures not just terms but how these terms are structured in relation to each other.
ESG Reporting Today
The working group reviewed corporate sustainability reports prepared using various ESG frameworks, such as those developed by the SASB, the Task Force on Climate-Related Financial Disclosures (TCFD), and the Global Reporting Initiative (GRI). Below are recommendations and considerations to generate effective, useful ESG reports. We also identify common issues in the ESG reports prepared today, and consider how standardization of the data can help.
Recommendations for effective ESG reporting
Render data machine-readable.
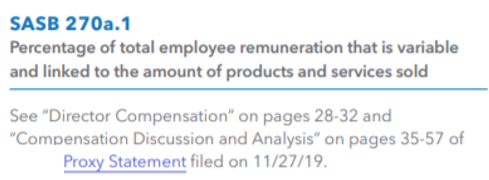
To be unambiguously machine-readable and searchable, a data standard is needed to enable the reporting of a “fact” (a value bundled with useful contextual data about the value) rather than a simple number or value alone (which is meaningless by itself). Consider a value such as “1.24733” depicted in the figure below, which by itself has no particular meaning.
Using data encoding standards: Modern data encoding languages (e.g., XBRL, XML, JSON, RDF) can be used to represent or encapsulate a value into a logical “fact.” A fact includes critical contextual information, for example, unit, date, reporting entity, and other descriptive information. Contextual information must be transported with the reported value to render the fact’s full meaning as computer-readable wherever the fact may be accessed. Modern data encoding languages do this; PDF files and spreadsheets do not.
The value “1.24733” has contextual information that can be manually read by reviewing the rows and columns in the table. To transform a value into a fact, requires capturing the contextual information as shown in the red boxes below the table, and transporting the metadata along with the value, i.e., bundled as a fact. Structured data standards allow contextual information to be encapsulated with the value so that when it is received by a computer, it is unambiguously described and thus unambiguously understood.
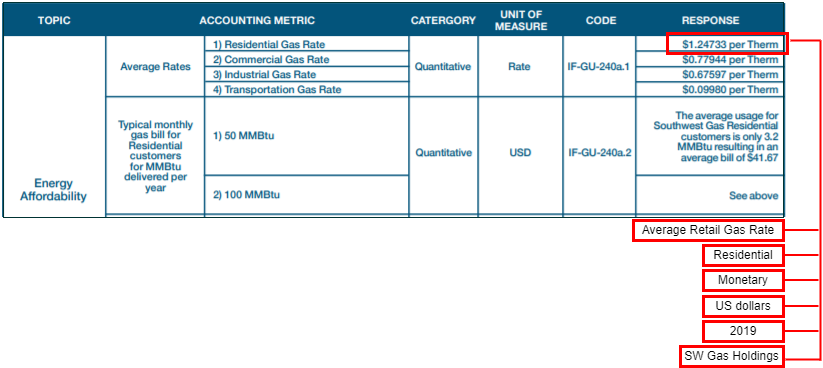
These contextual details can be seen as useful classifications of data. These classifications can be leveraged to unpack the meaning of a fact, group facts with common classifications, even validate facts as being logically compatible to be summed or totaled (e.g., same unit of measure, same reporting period).
Manage multiple ESG frameworks.
The number of ESG frameworks used by companies today is another demonstration of global interest, yet multiple standards, particularly because they may overlap in their coverage, can make it difficult to consistently prepare and analyze ESG data. Many companies choose from multiple standards to report their ESG metrics, responding to investor requests for a variety of data points that do not exist within a single framework.
To achieve accurate, consistent reporting in the presence of multiple standards, and absent regulatory reporting rules, there must be a common understanding or classification of the data points as used by the ESG community. This classification also must express sufficient detail to enable data integration across standards and to avoid potential ambiguity or misunderstandings. Such standardization forces consensus building and, ultimately, informs regulators. Regulators need to be able to create a single framework that allows reporting of data using classifications from multiple frameworks.
Using data encoding standards: Earlier in this paper we noted that machine-readable data is made possible when a reporting domain consists both of the terms to be reported as well as how those terms relate to each other within a framework. An example of this is U.S. public company financial reporting. This reporting area is backed by a codified standard managed by the Financial Accounting Standards Board (FASB). A machine-readable implementation of that reporting standard must specifically and concretely reflect the semantics or domain knowledge embodied in the reporting standard. Expressing a reporting standard in a machine-readable form is what makes it feasible to create machine-readable mappings between different reporting topics. For the practical purposes of this paper, the need is to mediate the current situation where there are multiple ESG frameworks in global use.
Taxonomy and ontology are the proper data science terms that name two complementary types of machine-readable data dictionaries. For our purposes, the differences are less important than what they have in common: they define a set of classifications for things and relationships between the classifications, e.g., facts in an ESG report.[1] This set contains both the elements that represent the types of classifications, and critically, how the elements are organized into meaningful relationships e.g., such as a hierarchy of terms from general to increasingly narrow classifications.
The process of developing the machine-readable implementation of reporting standards naturally accelerates agreement on: (1) the identification of terms, (2) the meaning of terms, (3) how the terms relate to existing domain standards (including multiple ones), and (4) how the machine-readable terms (elements or tags) relate to other terms. Additionally, these arrangements of terms can be constructed as specifications for what constitutes a correct compliance report. One should be able to see how all of this enables the automation of data quality, enabling regulators and investors to operate with greater efficiency, and reduce risk.
Help data users understand the relationships between ESG data in different frameworks.
Data users need assistance in understanding the relationships between different types of data reported. For example, how the computer-readable name of an element, for example, "WasteQuantityGenerated," relates to metadata, such as a definition, purpose-specific labels, data type (e.g., monetary, energy), and period type (duration or instant).
To enable consistent comparisons, it is also important to understand how an element in one standard, for example the SASB, maps to an element or elements in a separate standard, like GRI. Some relationships between different ESG frameworks are similar but not identical; the differentiation needs to be clearly understood so that companies can be compared accurately. This practical need for detail cannot be sufficiently satisfied by assigning a lengthy element name that attempts to list these relationships. It can, however, be satisfied with sophisticated but still standard uses of the data-encoding languages listed above. Because the technical methods are specific to the data encoding language, we will just say that the general practice is to create additional data dictionaries that (1) register narrow classifications about elements used to classify a fact, and then (2) relate these narrow classifications to the standard elements. The benefit of this approach is that it can be done by entities other than the authority behind a framework, and also supports multiple perspectives on these relationships.
Using data encoding standards: Data prepared in structured data format is defined as classification elements existing in relationships (like reality itself). The structure of the standard allows preparers to add new layers of relationships to existing relationships for further refinement and understanding.
Comprehensive elements can be broken down into their semantic parts (the "narrow classifications" noted above) so that the overlap is also machine-readable. This makes the data more useful for machine-learning activities. Each element is technically distinct, but many overlap in meaning. Structured data formats enable this overlap to be explicit and machine-readable.
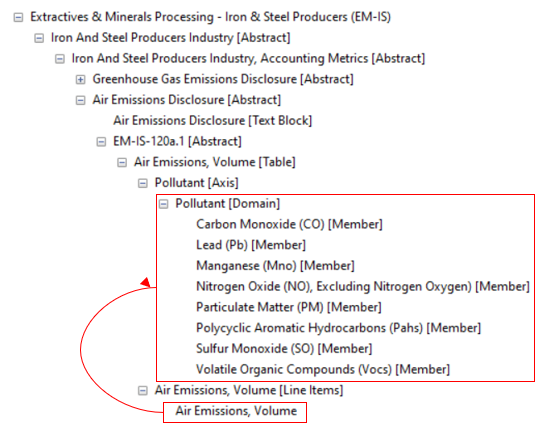
Reporting entities need to be able to add new (extensible) classifications where needed. Ideally, these extensions have clearly defined places to be inserted into an existing framework. An example of this may be the classification of a particular pollutant. In the SASB Taxonomy, which is shown in the figure below, Air Emissions Volume in the Iron and Steel Producers industry group can be further classified by eight different types of pollutants, such as Carbon Monoxide (CO), Lead (Pb), or Manganese (Mno). By combining the concept Air Emissions Volume with one of the pollutant members, a fact can be further refined by the appropriate pollutant classification.
A machine-readable framework should by design accommodate extensions. Further, extensions also can have additional classifications that break them into their semantic parts, just like official elements in a framework.
Allow issuers to use standards that are an appropriate fit for their company.
Companies differ by industry, size, and geography. Disclosures that are relevant to one company may not be relevant to a company in a different industry.
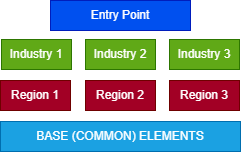
Using data encoding standards: A single taxonomy can be developed that contains a base set of elements with multiple entry points layered on top that are specific to the company’s industry or geography. An entry point limits the elements viewed to make it easier for the preparer to quickly identify the elements needed for their specific type of report. An entry point can include elements from different frameworks, making it an especially useful mechanism to give guidance to preparers. As shown in the figure below, while every company will use elements categorized as “BASE (COMMON) ELEMENTS,” one company may opt to also include elements in Industry 1 and Region 2. A second company can choose elements in Industry 3 and Region 1 to match their industry classification and geography.
Give issuers guidance on how to successfully implement ESG frameworks to tell their own story.
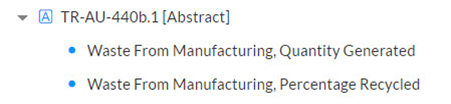
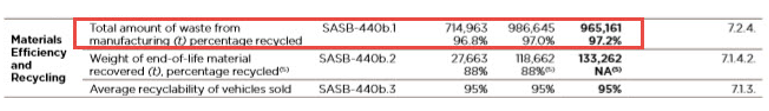
Some issuers wish to report more or different information than is required to be reported by a specific ESG standard. For example, the SASB framework for Transportation - Automobiles (TR-AU) calls for disclosure of the quantity of waste generated from manufacturing and the percentage of waste recycled as shown in the figure below depicting a section from the SASB Taxonomy.
These metrics are appropriately reported by the company that prepared the ESG report shown below.
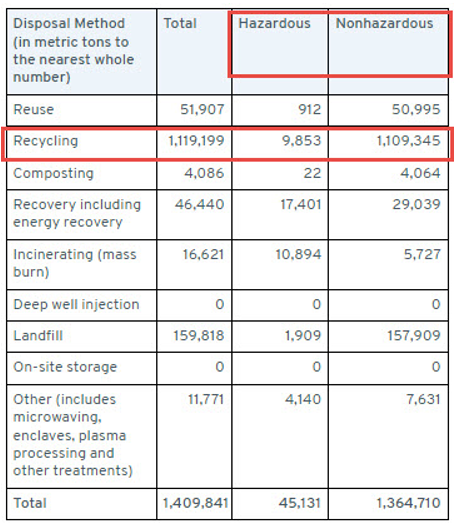
Other reporting entities, however, may choose to report different information believed to be relevant to their company that further clarifies their ESG standing. The figure below shows a company that chose to report the total amount of waste and the amount of waste recycled, but did not report the percent recycled although that amount can be computed because both amounts recycled and in total are included. They also chose to report the breakdown between hazardous and nonhazardous waste recycled.
Both companies may be seeking to accurately convey their own environmental impact related to manufacturing waste. Regulators imposing climate or other ESG-related disclosure requirements on companies must consider: 1) how to provide sufficient guidance so that companies like these can report data that is consistent and comparable, and 2) how to give companies the flexibility to report what is truly relevant to their situation.
Issuers need both clear guidance on exactly how they should report, but they also need to be able to provide input to what they should report. The ESG reporting domain is relatively new, certainly when compared to financial statement reporting. Any taxonomy designed to encompass ESG metrics will need to go through a maturation phase during which new elements may need to be added, deleted, or revised. Regulators should provide sufficient guidance for issuers to start, and be ready to adapt as companies begin to report more consistently and discover new information that they wish to convey.
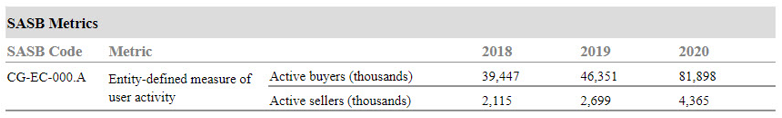
Some ESG metrics may be enhanced by additional explanatory text which could be conveyed through a footnote. The table in the figure below shows the number of active buyers and sellers which is a SASB defined measure. This fact could be further enhanced by a footnote explaining if these were buyers and sellers acquired over the course of the year (duration) or at a point in time (instant) which could be conveyed as a data standard footnote which is concretely connected to the fact.
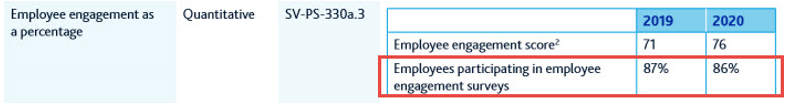
In the figure below, this company chose to add further clarifying information to the ESG fact employee engagement score. The percent of employees participating highlighted on the bottom row is a helpful artifact that the company chose to associate with each fact by way of the table. These facts, 87% associated with the 2019 score of 71, and 86% associated with the 2020 score of 76, could be tied to that fact in machine-readable form through a footnote. Use of footnotes for clarifying information may further enhance the usefulness of the data reported and assist companies in conveying their stories.
Using data encoding standards: Data standards can enable the machine-readable connection between a footnote and a fact. Regulatory guidance on how and when to use the various data standard tools such as footnotes, along with guidance on what is allowed and not allowed to be reported, is critical, particularly in the early stages of reporting. Regulators and standard setters must listen to issuers and data users as more reporting is conducted and data produced to ensure that requirements can be rapidly adapted to meet market needs.
Help issuers meet the needs of different data users.
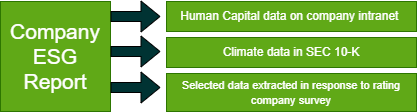
Institutional and individual investors, company employees, and rating companies, are all audiences for ESG data, and may be interested in different sets of ESG reported data. For example, while a company may prepare a 99-page report some users are only interested in a particular subset of the report; whereas other users are interested in a different subset; and another set of users want all 99 pages of data.
Each set of stakeholders may also look for data in different locations. Investors may review a company’s Corporate Social Responsibility (CSR) report posted on their website or explore facts embedded in the company 10-K. Employees may look to the company intranet. ESG rating companies may ask corporate issuers to respond to survey questions. The same facts or subsets of facts may need to appear in different reports, resulting in duplication of effort and possible inconsistencies as some reports and their data may be updated sooner than others.
At times, companies direct data users to other places to look for ESG data rather than duplicating it in multiple locations. The example from an ESG report below shows a situation in which the company has directed users to another location to find data of interest rather than duplicate the information.
Using data encoding standards: A single taxonomy of ESG reporting elements can have multiple presentations (i.e., arrangements) of elements to reflect different points of view as described above. Data encoding standards can express these multiple perspectives through different, explicitly defined arrangements of the elements. Because representation (as data) is distinct from visualization of data, the same dataset can support multiple visualizations as well as different sequences.
As depicted in the diagram below, a company ESG report, prepared once, can be used to populate particular data points on the company intranet and the company's Form 10-K and can be extracted by other data users such as rating companies. The single structured data document would eliminate the need to point readers to other documents because everything is sourced from the same place. This approach meets the needs of various users, reduces the burden of reporting multiple times by issuers, and improves the quality of data for reporting entities.
Allow data to be accurately disaggregated and totaled.
Data must often be disaggregated by geography, segment, or, as shown in the example below, by disposal method. Data quality can be improved by ensuring that totals sum accurately.
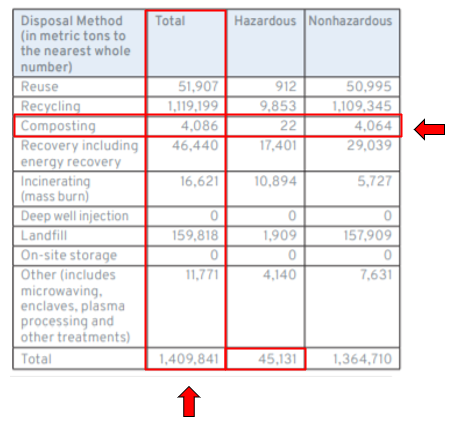
Using data encoding standards: Dimensional classifications of values are identified by adding more specific classifications to facts. A value for metric tons of waste disposed by composting can be augmented by information such as whether the waste is hazardous or non-hazardous. Dimensions give additional contextual information about facts that help differentiate facts that otherwise have the same primary classifications. By removing the dimensions (hazardous and non-hazardous), the value reported represents the total of the two summed together as shown in the second column on the table above.
Frameworks should be defined to take advantage of data-encoding languages that can model dimensions. Practically speaking, elements in a framework should avoid being monolithic, i.e., glomming together in a single element both its primary classification (e.g., disposal method) and its secondary dimensional classifications (e.g., hazard rating).
Business rules can be used to check the accuracy of a dimensional breakdown by embedding validation (business) rules in a taxonomy. This allows a data collector to publish a taxonomy that contains validation constraints for a report, helping automate data quality validation. For example, business rules can check that totals are accurately reported.
Consider again the table in the figure above: the composting total of 4,086 is equal to the hazardous (22) and nonhazardous (4,064) composting amounts; and the total metric tons of hazardous waste amount of 45,131 is equal to hazardous waste amounts for all the various disposal methods reported.
Business rules can be used to make sure that certain primary classifications also have required dimensional classifications (if so required). Business rules help preparers create reports with useful, compliant data. They help reporting entities validate data before submission to a regulator or distribution to investors. They also help regulators to more efficiently allocate their attention, and investors to more efficiently allocate their capital.
Ensure that graphical illustrations and narratives can be translated into computer-readable data.
Issuers often want the ability to visually tell their story through charts or other types of graphics. At the same time, investors and other researchers want concrete data that can be leveraged for their own analytics, for example as inputs to P & L models, time series analysis, for custom visualization tools, or for comparative analysis. While a graphical depiction of ESG metrics can aid readers in quickly understanding the data, data that is only reported as a visual representation cannot be ingested automatically by a computer.
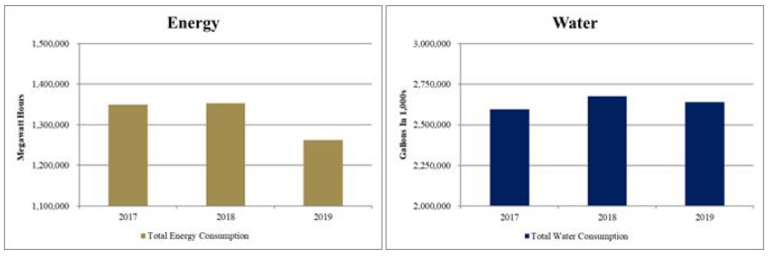
For example, the chart of energy and water consumption shown below was created to comply with the SASB standard for Services - Hotels & Lodging, in megawatt hours of energy consumed and thousands of gallons of water consumed. The graphs capture the trajectory of energy and water use but not the underlying data.
Issuers also may include facts within narratives that need to be captured as numbers to be rendered machine-readable. The figure below depicts a fact reported for the percentage of safety-related defect complaints investigated. The numeric fact reported could be imputed as 100% which the company conveys with the word “All”.
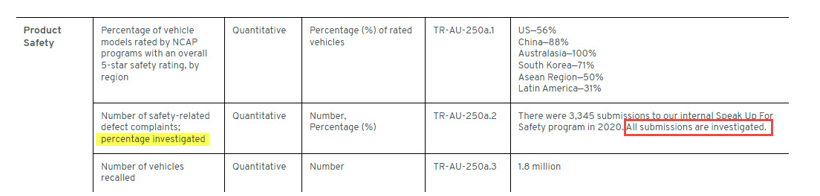
This fact can be rendered machine-readable by transforming the word “all” into “100%”.
Using data encoding standards: Taxonomies are a mechanism for describing data in high resolution. They can provide the appropriate context to enable accurate interpretation and do so without adding 'noise' and without a loss in detail.[2] They capture relationships between elements that can be used to automate the validation of data quality, and mitigate risks from automated downstream uses of data such as aggregation and artificial intelligence application. It may be true that "a picture says a thousand words," but structured data is where the greatest regulatory and investment value resides.
Although the value itself may not be represented in the visualization, some data encoding standards allow machine-readable facts to be embedded in the data file, hidden from view to human readers of the document but visible to data reading processes. This allows reporting entities to embed into an ESG report the numbers behind a visualization, these numbers being tagged (associated) with the appropriate elements as defined in an ESG standard. In the charting example above, the tagged facts for energy consumption in megawatt hours and water consumption in gallons do not have to appear on the HTML page but a computer 'reading' the document can extract the hidden but machine-readable facts automatically.
In the product safety example, the narrative “all” can be transformed into 100% by some data encoding languages such as XBRL. Transformations that are commonly used for US GAAP reporting include these noted in the table below.
| Zerodash | Converts “-” to “0” |
| Numwordsen | Converts a cardinal number like “Three” to “3” |
| Zero | Converts “no” or “none” to “0” |
Some transformations were developed by XBRL International as part of a transformation registry. The SEC has developed additional transformations specific to their reporting requirements. To adapt to ESG reporting may require more transformations based on what companies are reporting today.
The availability of structured data can also enhance data visualization. For example, calculation relationships between elements (and thus the facts tagged with those elements), and disaggregation of data through dimensions both provide new perspectives for visualization and new analytics to be mined by artificial intelligence systems. There is more to visualization than static drawings of lines, bars, and pie charts. The market for 3rd party and open-source visualization tools has been well-supported by the trend towards machine-readable data that is expressed in non-proprietary data encoding languages. Why force people to look at a fixed picture when they can plug into a report the visualization of their choice?
Enable commingling of ESG with other data.
Allow data mashups so that ESG data (e.g., water consumption) can be commingled with financial and other kinds of data to investigate and identify correlations.
Using data encoding standards: The high-resolution semantic details that can be expressed in a taxonomy allow data providers to express, and thus users to find, meaningful, detailed aspects in common across filings -- hundreds of thousands of filings -- with speed and accuracy. We can be assured that we are looking at an identically defined fact in different reports, and this commonality allows us to build bridges between reports. This is a significant improvement over attempts to compare related data points across different reports based on simple labels.
For the many reasons noted above, the SEC requires U.S. public companies to structure their financial statement data in XBRL format. If public company ESG or climate-related data is developed in the same structured data format, investors and analysts would be able to use the same database and analytical applications with both climate and financial data. That would reduce the need for issuers to learn new applications and keep the cost of data extraction and analysis low, providing an easy on-ramp for financial data users that wish to consume climate or ESG data in addition to financial data.
These cost advantages are simply because data in structured format is easier to process. The Global Director of Equity Data at Morningstar noted in a video, “Extracting data from an HTML document takes at least 20 minutes, from a good quality PDF, takes around 30 minutes, from an image around 50 minutes. Data pulled from an XBRL file, though, can be extracted in 1 to 2 seconds…lets us focus on better analytics rather than scraping data from documents.”
In the same video, the Head of Company Data Strategy and Management at Refinitiv, an LSEG business, noted, “Given how successful XBRL has been in the financial data space, I’m hoping it will become an enabler for more standardized reporting across non-financial data like ESG.”
Eliminate inconsistencies in data types and units to enhance comparability.
Data must be unambiguously understandable and comparable to reward the highest performing reporting entities. An ESG framework may call for the reporting of certain data types, for example monetary or energy. In the example below, materials used are reported with a data type of mass and with units specified in millions of pounds. A company in the same industry but based outside the U.S. may use a unit of kilograms with the same mass datatype.
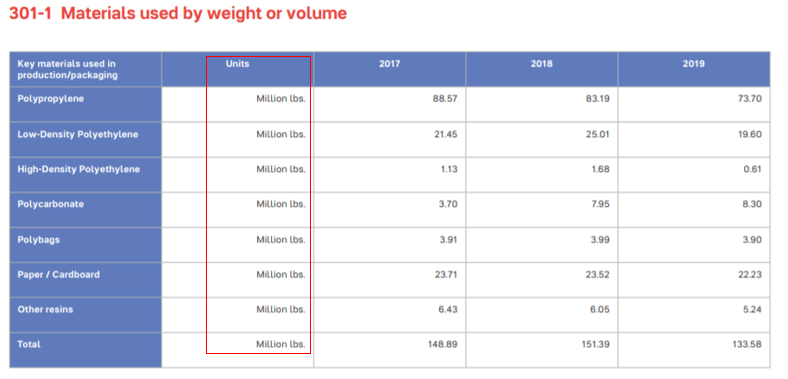
Using data encoding standards: Globally used data standards can adjust for differing units within the same data type, for example US dollars or euros as monetary, or kilograms or pounds for mass, as in the example above.
Machine-readable standards for units already exist, and are conveniently organized by class and formula for conversion within a class. Thus, software can consistently identify the use of different units of measure, determine if they are convertible between each other (within a class, e.g., volume, energy, mass), and then reliably automate the conversion. This means that a single data point can be reported into multiple frameworks that each require a specific data type but can accommodate, through automation, each framework's prescribed units of measure (e.g., MW, GW, W).
Adopt a standard that can constrain data to specific units.
Regulators may wish to constrain reported data to a standard unit or set of standard units, e.g., monetary data to US dollars, or energy data to kilowatt hours. Regulators should ensure that the definition of the element does not conflict with units required.
Using data standards: Data standards can make units explicit, with every number associated with a unit. For example, the Federal Energy Regulatory Commission (FERC) requires public utilities to report in specified units of US dollars for monetary facts, and MWH for energy-related facts.
Assist issuers in preparing good quality data with minimal burden.
Regulators, investors, and other users need consistent, timely ESG data. Developing a taxonomy for an existing reporting domain, like ESG, can help to further define what needs to be reported, and how that information should be reported. For example, the building of a taxonomy requires determining the specific data type for each fact - is it an amount or a percent? Monetary or energy? Making those decisions and requiring the reporting to adhere to those standards, makes the reporting process more efficient, and increases the consistency of data reported. This approach ensures that data can be checked, with appropriate units calculated (e.g., US dollars as monetary data type, inches as length data type, gallons as volume data type) to aid issuers as they report, and to improve the consistency and correctness of data produced.
Using data encoding standards: Imagine if regulators and standard setters had equivalent expressions of their codifications in a machine-readable taxonomy such that machine-readable reports could be validated against the taxonomy as complete (all facts required to be reported are reported), and consistent (totals foot, and numbers are consistent in their unit of measure, reporting date, and entity ID). The effort to create a framework taxonomy drives specificity and consistency into the framework. A better framework reduces the difficulty in using it to create good quality data with minimal burden.
Provide guidance and validation tools to confirm that a submitted report is correct.
Regulators should provide a consistent, clear definition of a “correct” report to give added guidance to preparers.
Using data standards: The structure and restrictions of data standards allow us to build “fences” around what can be reported to conform to a definition of correctness, based on mathematical calculations (totals and subtotals add correctly, statement data foots), completeness (mandatory facts such as entity identifiers, time period, and required disclosures are flagged if absent), and that facts are compatible with other facts, compatible with units, etc.
Make data “portable,” easily accessible.
Enable easy portability of data to different data systems.
Using data standards: Data encoding languages provide a serialized[3] data package containing a machine-readable version of the data and the data model (e.g., schema, taxonomy, ontology). Unlike a relational database that provides tables of data alone, data encoding languages like XBRL, XML, and some others can preserve the full record of what the data means. Being serialized as text the data is easily distributed via data feeds such as RSS.
Give data users the ability to identify the source of the data.
Allow data users to trace computed values back to the specific facts that were the input to the computed values. For example, a ratio should be linked to the facts that were used to calculate the ratio.
Using data standards: In some data-encoding languages (i.e., XBRL), calculation reports can indicate the values that add to, or detract from, a specific fact. Calculation inconsistencies can indicate that a necessary contributing value is missing. More complex arithmetic validations may also be available to both identify related facts and validate the arithmetic relationships.
Conclusions
We encourage issuers and users of ESG data to provide input to the SEC regarding the climate-disclosure proposal (comment due date May 9, 2022). SEC Chair Gary Gensler noted in his comments regarding the proposal, “… investors get to decide which risks to take, as long as public companies provide full and fair disclosure and are truthful in those disclosures. That principle applies equally to our environmental-related disclosures, which date back to the 1970s.”
We also ask issuers to be sure to stay informed of the work of the ISSB to build on the existing investor-focused reporting initiatives—including the CDSB, TCFD, VRF’s Integrated Reporting Framework and SASB Standards, and the World Economic Forum’s Stakeholder Capitalism Metrics. The ISSB aims to develop the standards in such a way that they can be mandated and combined with jurisdiction-specific requirements or requirements aimed at meeting the information needs of broader stakeholder groups beyond investors, with the beginning focus on climate information. Given the potential for this important work to impact any regulatory mandates, issuers are encouraged to provide feedback in their public consultation which is also expected this year.
And finally, to regulators considering how to guide companies to report useful, consistent ESG metrics, we urge them to adopt the technical recommendations made in this paper. ESG data, properly prepared in structured, standardized format will best serve the investment community’s needs for unambiguous, high-quality data, data-driven automation, and a reduction of burden by reporting entities.
Thanks goes to the members of the XBRL US ESG Working Group, which is comprised of representatives from the investor, investor relations, corporate governance, public company, accounting, ESG and XBRL communities, including XBRL US, Workiva, Toppan Merrill, Toniic, the National Investor Relations Institute (NIRI), Donnelley Financial Solutions (DFIN), Curley Global IR, LLC, Carlow Consulting, LLC, and the AICPA, among others.
Access human- and machine-readable ESG reports for Moody's Corporation and Etsy, Inc.
[1] For the remainder of this paper, we will refer to "taxonomy." However, readers should note that ontology may also be applicable for some descriptions of a data dictionary.
[2] See The Mathematical Theory of Communication, by Claude Shannon. This is the classic text on information theory. The book's introduction is approachable and instructive to non-specialists.
[3] Meaning that the data can be packaged in text files and thus easily transmitted and stored with existing systems.